…Especially when integrating the results in Azure Pipelines.
Context
Working on my solution that I will present at ITCamp this year, I decided to get up to speed with what’s new in the .NET Core world, with focus on tooling. I was really happy to find out that there is finally open source code coverage support for some months now, a thing that I was waiting for … well the beginning of .NET Core.
Now, skip forward a day, after much fiddling around and trying out different approaches, I discovered with some degree of disappointment and frustration that asynchronous methods are not included in the code coverage report generated by the ReportGenerator tool used in the pipeline tasks ReportGenerator (did you expect a different name? :) ) and Publish Code Coverage Results.
Well, I definitely accept the possibility of missing out on some key details and going about doing this in a wrong way, but until now I haven’t found anything that could help me fix this. But I do intend to update this article in time, when new information comes my way.
The full story
Firstly, this is not an article on how to collect code coverage information on .NET Core projects and display the reports in the Code Coverage tab of a successful build in Azure Pipelines, because there are a lot of good articles out there and I’ll link to some of the ones I've read through (in no particular order):
- https://medium.com/@tarik.nzl/publishing-test-coverage-with-net-core-and-vsts-build-pipelines-39a2f29dfa12
- https://www.hanselman.com/blog/NETCoreCodeCoverageAsAGlobalToolWithCoverlet.aspx
- https://www.hanselman.com/blog/AutomaticUnitTestingInNETCorePlusCodeCoverageInVisualStudioCode.aspx
- https://gunnarpeipman.com/aspnet/code-coverage/
- https://medium.com/@tsuyoshiushio/azure-devops-yaml-pipeline-with-net-core-and-coverage-report-b84b5b282a95
The source code from which this article got born can be found here (but it's currently a work in progress): https://github.com/ecraciun/ServerlessRoboRestaurant.
Ok, now let me show you exactly what is the problem that I have discovered.
This is how the logs in the Test task of my pipeline looks like:
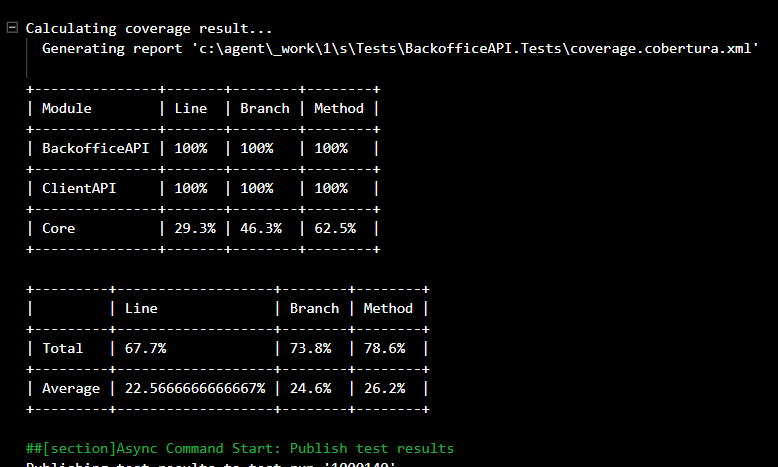
This is quite accurate to the tests I've written so far. The summary file is saved as coverage.cobertura.xml. But more on this a bit later when I explain my present build pipeline tasks.
This is how the report gets generated from the summary file mentioned earlier:
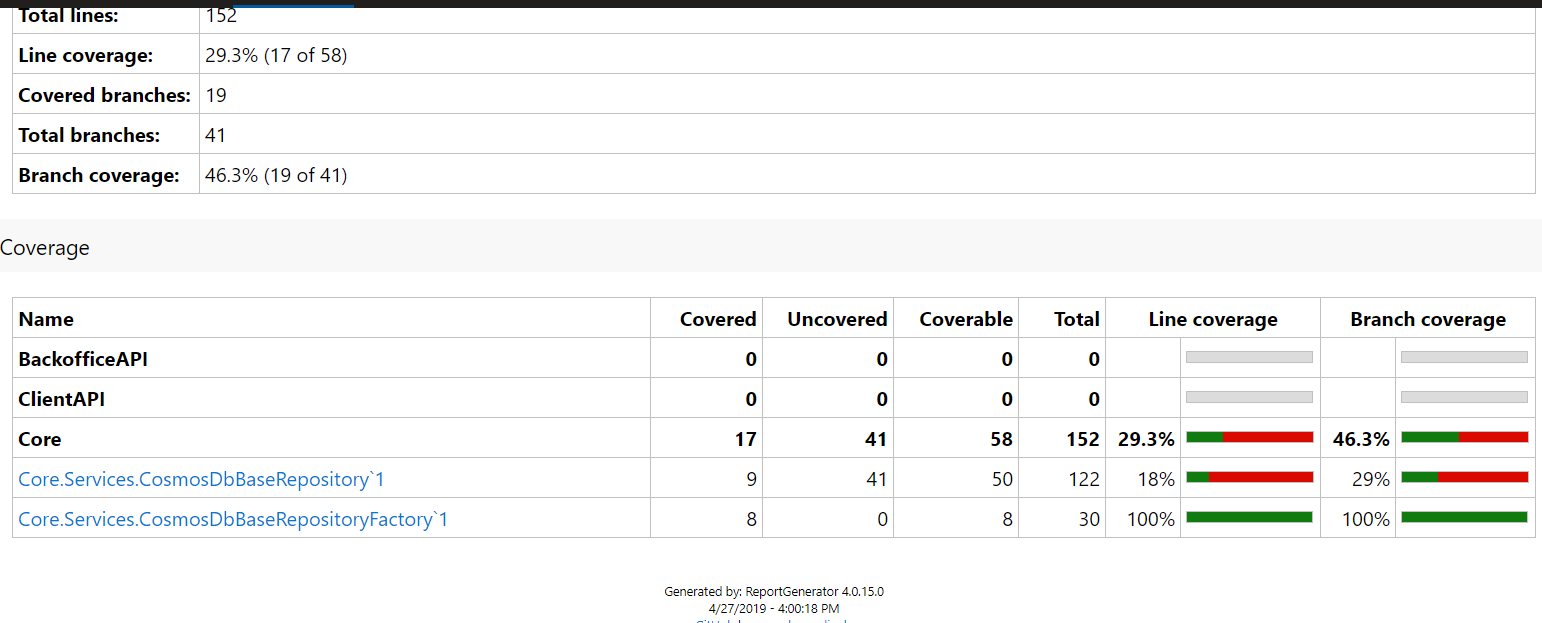
These two things don’t look at all the same, I think we can all agree with this. The found discrepancy is the basis of this article.
Having the inconsistency out in the open, I'll guide you through what I did and discovered so far, starting from the build pipeline, as it is in the moment of me writing this:
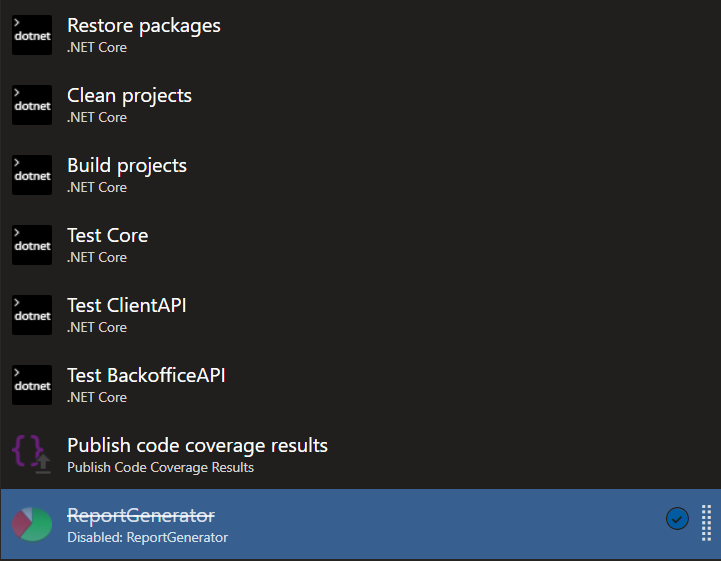
You might be wondering why there are 3 separate test tasks, and you have every right to do so. I’ll give you a bit of background on how I got here and why, but I will probably change this further down the road, because I consider this setup an experimental one.
Initially I had only one test task, that ran against all *.Tests.csproj files, with these arguments (for understanding what the custom parameters do, please read the official documentation here):
--configuration $(BuildConfiguration) --no-build /p:CollectCoverage=true /p:CoverletOutputFormat=cobertura /p:Exclude="[xunit*]*%2c[TestsCommon]* *%2c[*.Tests]*" /p:ExcludeByAttribute="ExcludeFromCodeCoverageAttribute"
The main artifact produced by this step was a coverage.cobertura.xml file inside the root folder of every test project, which was picked up by the (now disabled) ReportGenerator task. This task then merged the files into one single summary file (which is really an awesome feature). And last but not least, that summary was being published as a code coverage result. Unfortunately, I ended up seeing a very different result (see Figure 2). My first assumption was that the merging was not working as expected, since it showed only the results from one test project, and even those were quite incomplete.
What I did next is, starting from this article (found also in the above references list), fixing the merging presented there as per the official documentation of the tool (it can only merge its own .json format, not cobertura xml), I ended up creating a test task for each of the test projects I had in the solution so far. And of course, chaining them accordingly. I’m not exactly happy with this setup, but it did get me closer to the root cause. Up next, I'll explain in order what each test task, in order, has as arguments.
Test Core task (first):
--configuration $(BuildConfiguration) --no-build /p:CollectCoverage=true /p:Exclude="[xunit*]*%2c[TestsCommon]*%2c[Core.Tests]*" /p:ExcludeByAttribute="ExcludeFromCodeCoverageAttribute" /p:CoverletOutput=./result.json
Test ClientAPI task (second):
--configuration $(BuildConfiguration) --no-build /p:CollectCoverage=true /p:Exclude="[xunit*]*%2c[TestsCommon]*%2c[Core]**%2c[ClientAPI.Tests]*" /p:ExcludeByAttribute="ExcludeFromCodeCoverageAttribute" /p:MergeWith=$(Build.SourcesDirectory)\Tests\Core.Tests\result.json /p:CoverletOutput=./result.json
And finally, the Test Backoffice API task:
--configuration $(BuildConfiguration) --no-build /p:CollectCoverage=true /p:CoverletOutputFormat=cobertura /p:Exclude="[xunit*]*%2c[TestsCommon]*%2c[Core]*%2c[BackofficeAPI.Tests]*" /p:ExcludeByAttribute="ExcludeFromCodeCoverageAttribute" /p:MergeWith=$(Build.SourcesDirectory)\Tests\ClientAPI.Tests\result.json
As you can see, only the last one sets the cobertura output format, which is the one that can be consumed by Azure Pipelines. Also, in this way, I was able to collect only the coverage information I needed, basically from the assemblies being tested, and not also from the assemblies being referenced or doing the testing. You do have more control this way.
But let’s back to the main problem. Setting up the tests this way, produced the logs showed earlier (see Figure 1). I have tried targeting .NET Core 2.1 or 2.2 in all projects, and using the coverlet.msbuild nuget package 2.5.1 and 2.6.0 (latest at the time of writing). But to no avail.
Next up I downloaded the ReportGenerator source code and debugged the report generation. That’s where I found something interesting.
Reaching the CoberturaParser.cs class, and more exactly the ProcessAssembly method, I discovered that the return value for, let’s say in my case ClientAPI assembly, yielded no results. But why? I could clearly see it in the generated coverage XML. Here is an excerpt:
<package name="ClientAPI" line-rate="1" branch-rate="1" complexity="24">
<classes>
<class name="ClientAPI.GetMenu/<Run>d__0" filename="c:\agent\_work\1\s\ClientAPI\GetMenu.cs" line-rate="1" branch-rate="1" complexity="9">
<methods>
<method name="MoveNext" signature="()" line-rate="1" branch-rate="1">
Also, to preserve the current source, here is the first part of the ProcessAssembly method:
private Assembly ProcessAssembly(XElement[] modules, string assemblyName)
{
    Logger.DebugFormat("  " + Resources.CurrentAssembly, assemblyName);

    var classNames = modules
        .Where(m => m.Attribute("name").Value.Equals(assemblyName))
        .Elements("classes")
        .Elements("class")
        .Select(c => c.Attribute("name").Value)
        .Where(c => !c.Contains("$") && !c.Contains("/<"))
        .Distinct()
        .Where(c => this.ClassFilter.IsElementIncludedInReport(c))
        .OrderBy(name => name)
        .ToArray();
Putting these two pieces together, the answer is obvious. That .Where(c => !c.Contains("$") && !c.Contains("/<")) filtering cuts out all my tested methods.
At this point, going over the cobertura.coverage.xml, I’ve noticed that ALL of my asynchronous methods were captured this way. But not the synchronous ones, the ones appearing in the actual report (see Figure 2).
Re-enabling coverage for the test methods, here is what is getting generated:
<package name="BackofficeAPI.Tests" line-rate="0.993" branch-rate="1" complexity="14">
        <class name="BackofficeAPI.Tests.GetOrdersTests" filename="c:\agent\_work\1\s\Tests\BackofficeAPI.Tests\GetOrdersTests.cs" line-rate="1" branch-rate="1" complexity="2">
          <methods>
            <method name="CreateTestData" signature="()" line-rate="1" branch-rate="1">
              <lines>…</lines>
            </method>
            <method name=".ctor" signature="()" line-rate="1" branch-rate="1">
Of course, the async test methods get the same naming convention ClassName/<MethodName>.
Just to make sure, I commented out the .Where() call, debugged again, and no surprise, the resulting report included everything in the XML (see Figure 4). Of course, this is not exactly pretty, since it considers a method of a class as a class of its own. But the values are at least the correct ones.
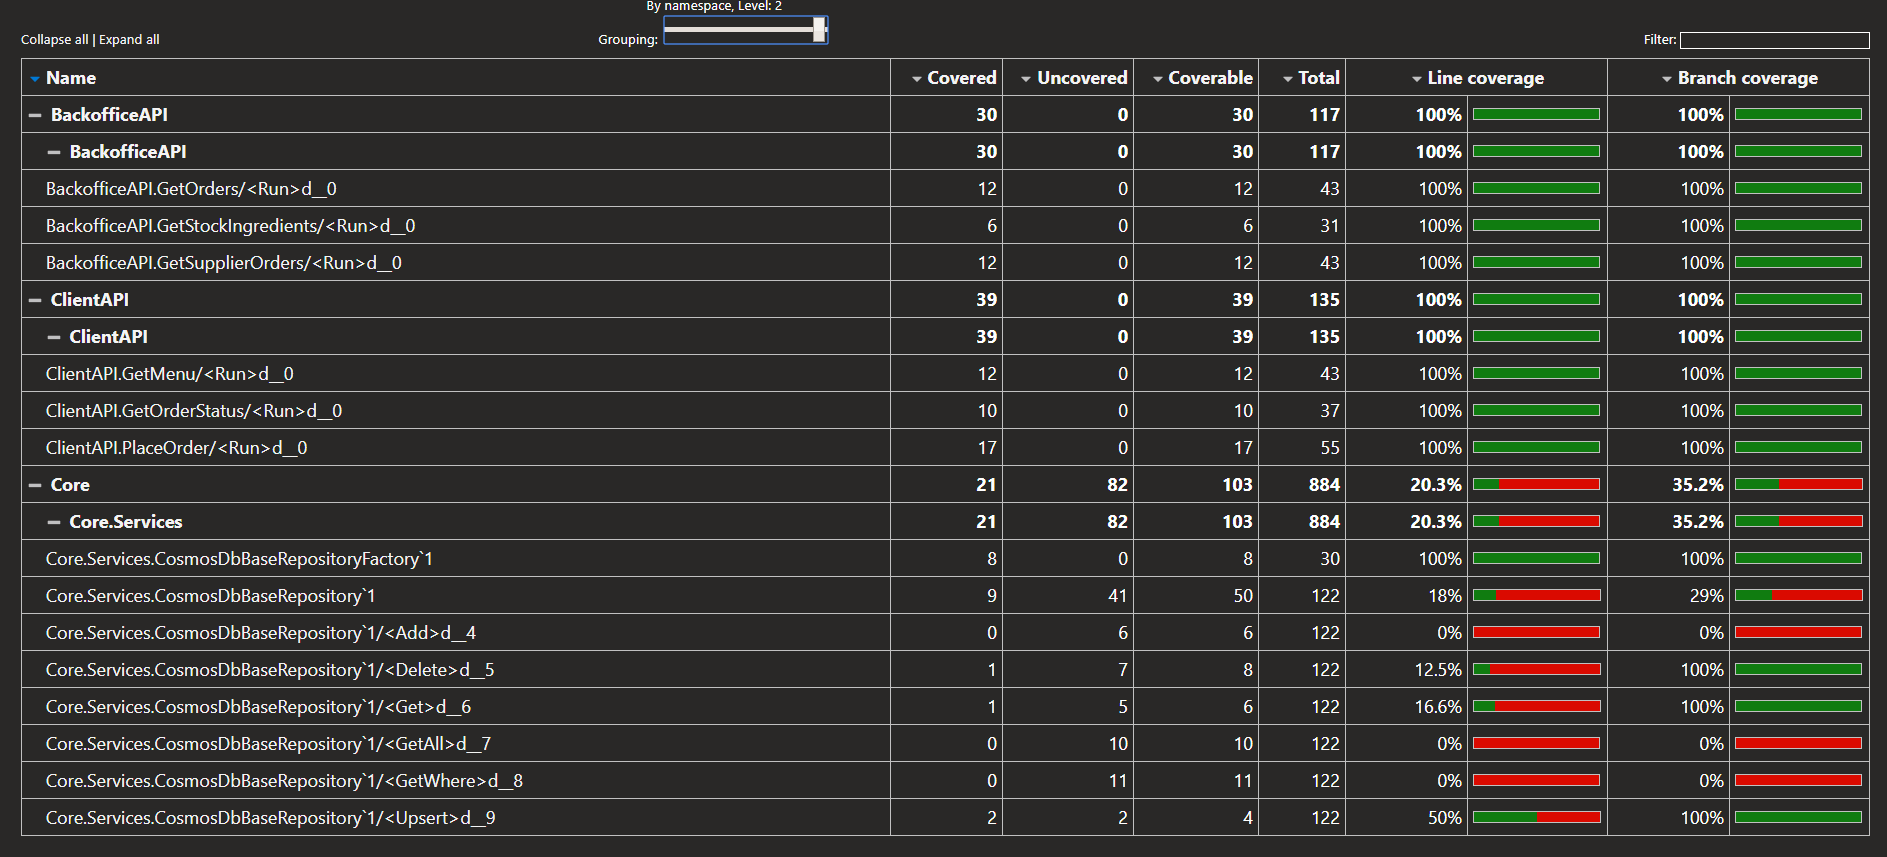
Conclusion (but not yet a solution)
Ok, at this point it’s clear to me that asynchronous methods are getting a different representation in the generated coverage XML and are ignored by the ReportGenerator tool.
For the time being, I will not invest any more time in getting my code coverage reported correctly since it’s probably a tooling problem.
What I will do, is try to see what are the Cobertura format specifications and then reach out to either the coverlet.msbuild people or the ReportGenerator people depending on my findings, providing them with a small proof of concept, to see how they can help me get this fixed.
And of course, I will keep this post updated with any new findings.
Stay “tuned” until next time!